Process Flow Charts- The Tool To Save Time Anywhere
Lead Engineer- Michael Kirk:
Saving 9 minutes a day for an entire year will give you an additional 54 hours to enjoy however you’d like.
This is a real world condition that was experienced for 3 years at my last living location. This allowed me to stay up later, enjoy my mornings fuller, and arrive to work earlier.
Save Time At Home-
In short, a Process Flow Charts lists every step to complete a Task, the list is reviewed for non-value added steps, and those steps are eliminated.
A Process Flow Chart is a necessary tool applied in every mass production environment. A Process Flow Diagram is best used anywhere a task is repeated often or consumes significant time.
A Life Process Flow Diagram
We apply Industrial Engineering to Life and conduct this real life study. For best results, You should go through your own process as normal, and a partner should either video record you, or write down every step and detail. The more mundane the steps, the more opportunities for optimization.
To Recap:
- Prepare to record with Paper and Pen or Camera and preferably with a partner.
- Start your Process as normal as possible, complete your process as normal as possible.
- Write down every step along the way.
- Review your list, marking each Step as Value Added, Necessary Non-Value-Added, or Non Value Added<
- Look to eliminate Non-Value Added activities, or arrange them to limit the amount of time it consumes
There will be moments that you aren’t sure what you usually do next. This means your process is ‘Out-Of-Control’. By simply standardizing your process, you will begin saving time and have a benchmark to improve against.
Process Flow Chart- Example:
This Process Flow Chart starts in bed. Here is what was written down:

This was typed up in excel and the work began. We began classifying. Classifications to aid you in optimization. Don’t overthink it. Optimize and eliminate All Non-Value Added activities.
Value Added is when you get closer to your goal by doing a step. Non-Value-Added is when you accomplish nothing. Necessary Non-Value-Added is when a step does not create value, but is necessary to give you the ability to create value.
In a factory, Value Added Steps modify a part. In this example, modifying your body to prepare for the world. A Non-Value Added step in a factory would be picking up tools from another department. It doesn’t create value. Obtaining the tool is necessary, but the movement to get the tool may not be necessary. Turning on a shower does not make your body cleaner, but it is required as a step to get cleaner.
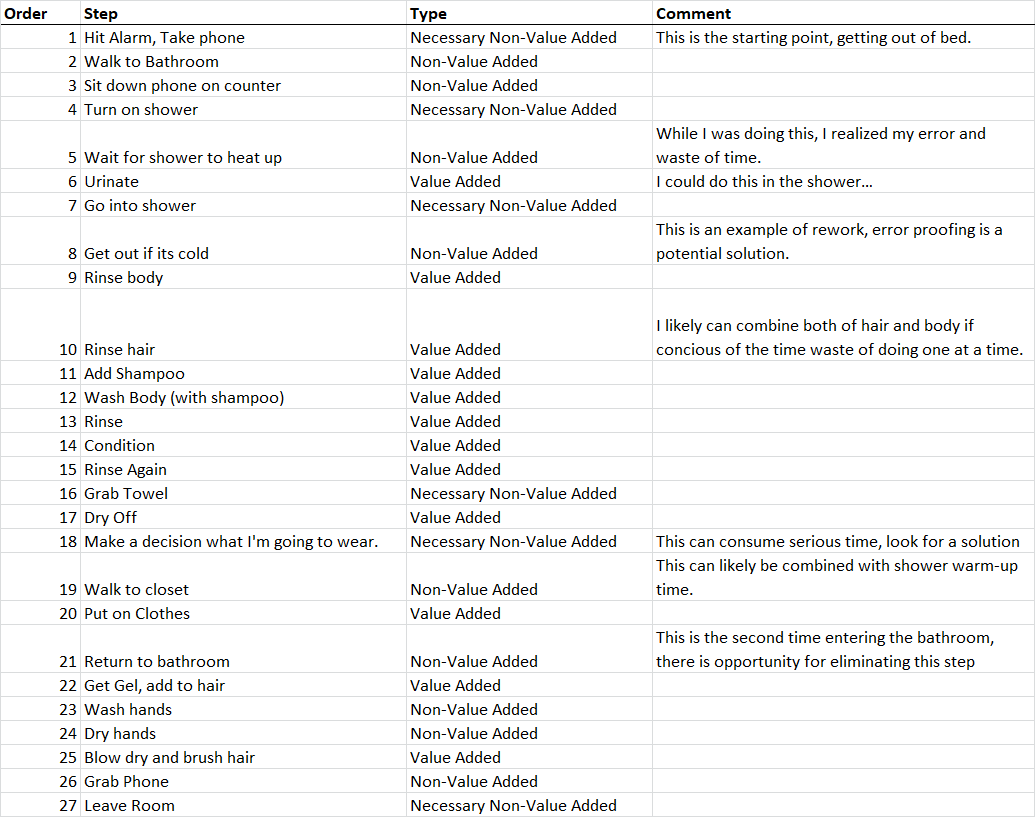
It was obvious during the process that time was wasted waiting for the shower to heat up. Anything that could be done before getting wet should be. This means that late night preparation may not be beneficial. Modifying the order, the steps choosing clothes and placing your phone in clothes are started immediately after the shower is started.
This simple re-arrangement eliminates the non-value added step of waiting for the shower and accomplishes tasks during this step.
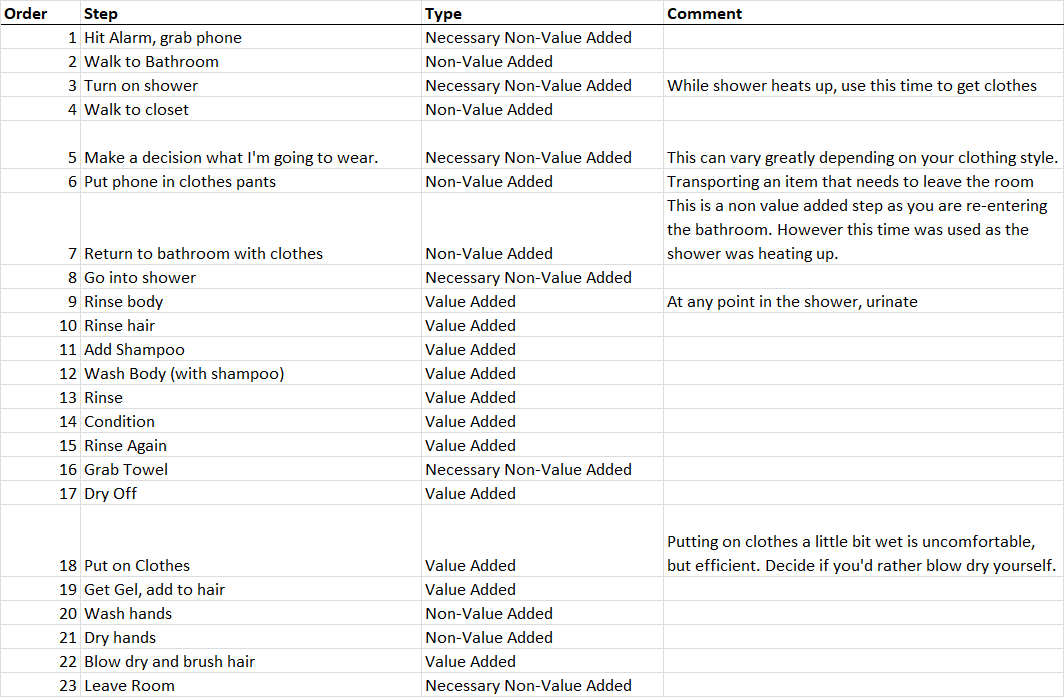
Example Conclusion
3 minutes per day was saved in this example. Considering this was the morning routine of an Industrial Engineer, you will likely save even more time.
This is expected to save an additional 900 hours in life.
Instant Time Savings
Running this study in your own life will give you plenty of ‘Ah Ha!’ moments. Time that used to disappear will now appear in-front of your own eyes as non-value-added.
As you go through your own Process live, you will start seeing the waste. When you have completed the process, review, and optimize.
Implementation
Consider what Life Processes can be optimized. A morning routine, a bed time routine, getting home from work routine, recipes you make often, outdoor tasks, etc…
The detail of your process is up to you. The more Steps recorded, the more opportunities for optimization.
Pick a process and use this Process Flow Chart as a tool to visualize and eliminate waste.