Baby Burp Statistics- How long to pat to get 95% of burps out of your baby.
For anyone who wants to learn ‘How To Apply Statistics To Life’, the section with that title will get into the mathy details. If you are a parent and just want to know how long to pat your baby on the back, you will benefit from the sections titled Summary and The Data.
Summary
The original goal was to figure out how long to pat our baby to ensure we got 95% of burps out. However, this same data can be used to find the laziest/easiest solution to get burps out while minimizing risk of an upset baby.
For parents I have 2 options. You can use the outcome of 5 babies we studied, summarized in the next paragraph and additional details in the section ‘Our Data’. Or you can take 2 or 3 measurements to figure out your own baby burp statistics, as described in section ‘How To Apply to Your Baby’.
For 95% of burps, with 90% confidence you need to burp for 6 minutes. For 85% of burps with 90% confidence you can burp for 2 minutes. For 85% of burps, no confidence you can burp for 2 minutes. And for 73% of burps, no confidence, you can burp for 1 minute. This last one I call ‘2AM burp strategy’.
How To Apply Statistics To Life
To begin, we timed 25 samples of our newborn burping. I put this data in Excel, calculated the sample mean and sample standard deviation. These are straightforward formulas and if you are not familiar, google can answer your excel questions in seconds.
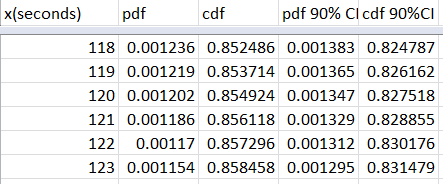
With the sample mean and standard deviation I could calculate what a statistical distribution should look like in excel using =EXPON.DIST( or =NORM.DIST( or similar. Quick stats lesson, understand Cumulative Distribution Function and Probability Distribution Function. CDF is the probability of the event from 0 to whatever value, for instance 60 seconds is 76%. PDF is the probability at that exact time, for instance at 60 seconds is 0.3%. These require, mean and standard deviation, and a value to calculate against. For instance, 1 second, 2 seconds, 5 seconds, etc… In graphing I use all integers 0-600 seconds.
Comparing to real world results, our data did not seem to fit popular distributions like Normal, Uniform, or Exponential. Most of the data seemed to appear around 0-30 seconds, but the Probability Distribution Function for normal distribution predicted this to happen around 50 seconds. This made it clear normal distribution did not fit the data.
To narrow down the next potential distributions, I found https://en.wikipedia.org/wiki/Probability_distribution_fitting which prompted a symmetry test. Upon finding the data was not symmetrical, I began testing the data for distributions that were non-symmetrical.
I repeated the same steps as before with Log Normal using =LOGNORM.DIST( and found this lined up to what I would have expected. For my final check I used excel to calculate the Cumulative Distribution Function of the Log Normal Distribution, and compared that with a sample Cumulative Distribution. As an example, with our sample of 25, we should expect the 90% CDF to be similar in seconds to whatever the 22nd or 23rd longest sample.
Our data
This Data can be broken up into individual babies and all 5 sampled baby’s data.
For the individual babies, I have attached the spreadsheet above with all babies. However as I trust my measurement method was consistent, I’ll review Aurelia Kirk’s data and also ‘All Babies’.
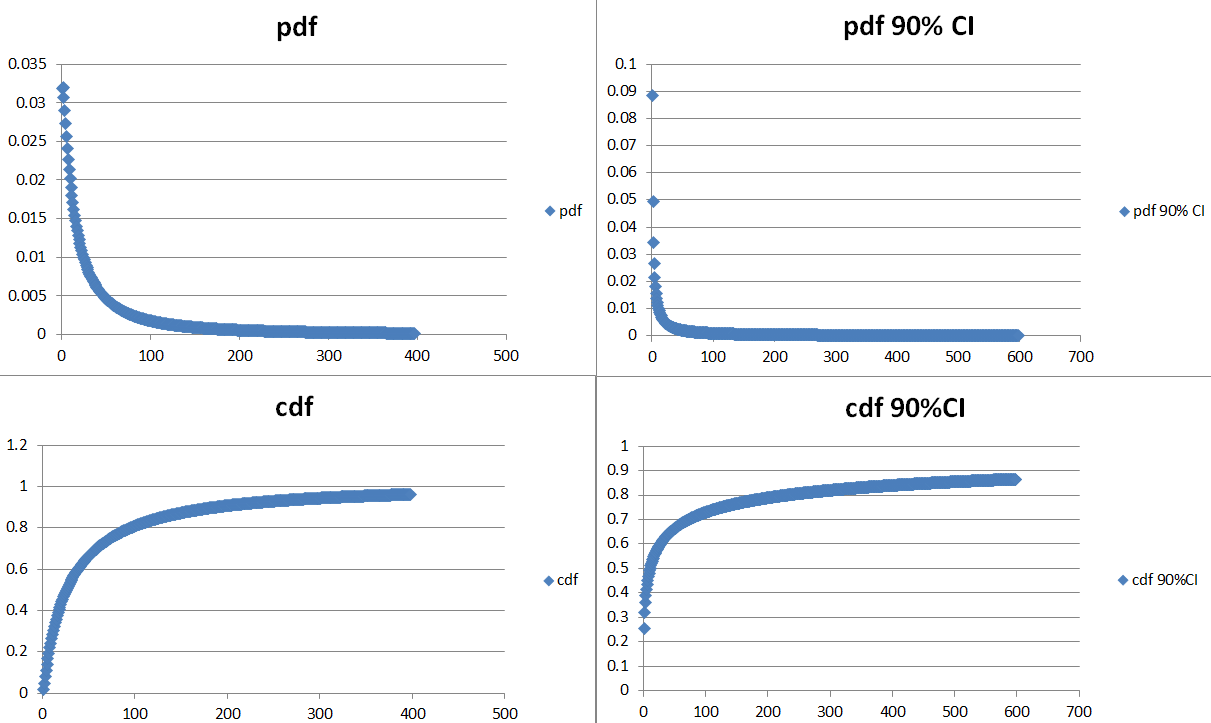
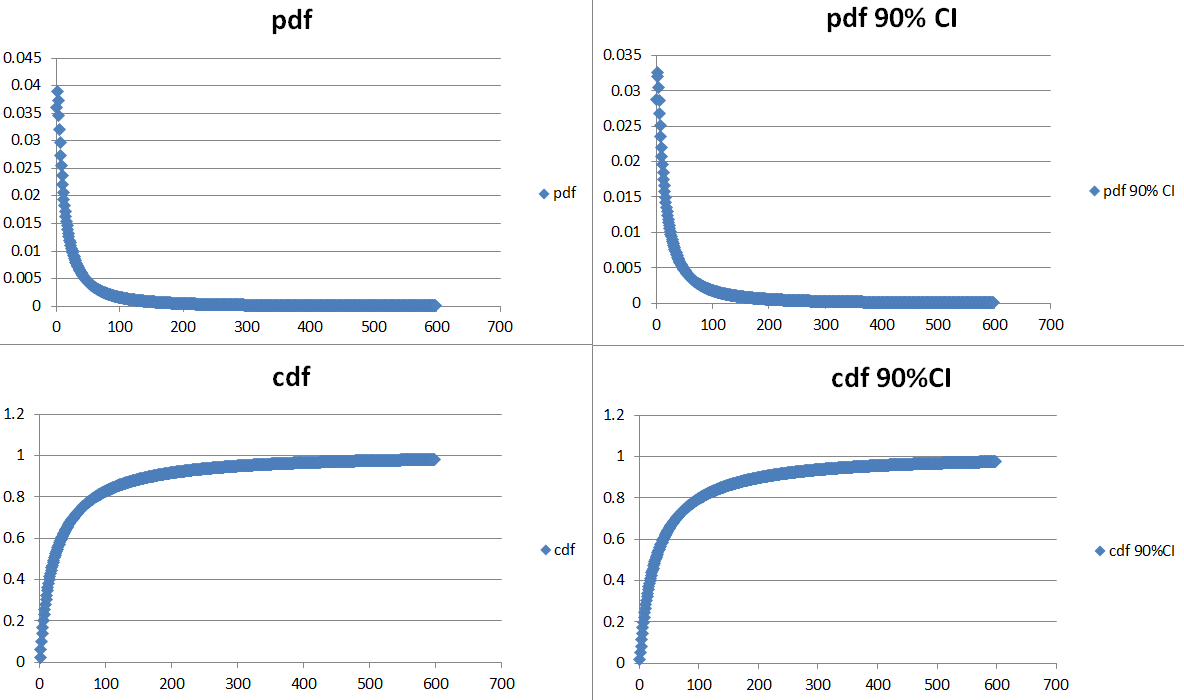
Here is Aurelia’s PDF, CDF, and their respective values at 90% CI. The 90% CDF is probably the most useful, find your desired percentage on the left(y-axis), and locate the number of seconds on the bottom(x-axis). Note that the y-axis can be multiplied by 100 for a more familiar percentage(0.8 = 80%)
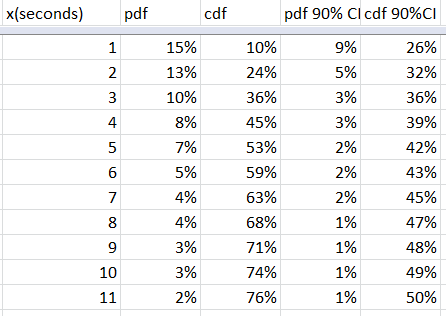
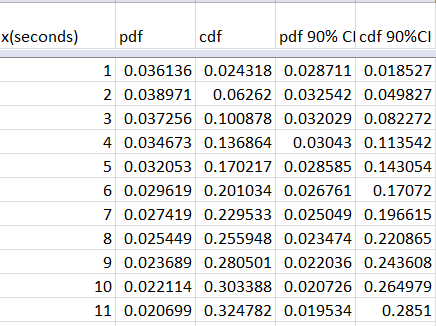
Focusing on the first few seconds
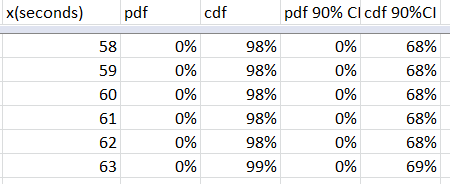
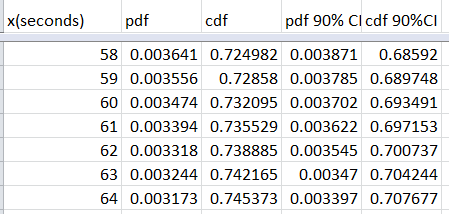
At 60s
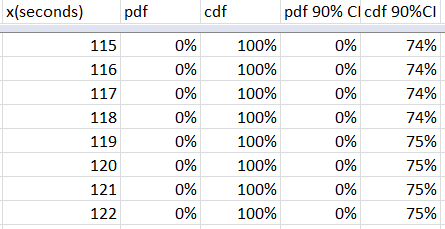
At 120s
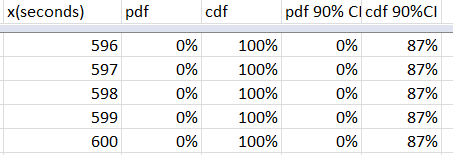
At 10 minutes
The data for all babies:
First few seconds
At 60s
At 120s
Its not exactly scientific, but seeing all of this data, I find myself patting Aurelia somewhere between 60-180s.
How To Apply to Your Baby
If you want to assume our 5 sampled babies and 100 samples is good enough for you, you can use my simple rule of thumb- Middle of the night burp for 1-2 minutes. Mid-day, I burp for 3 minutes. And if I’m sure there is a burp stuck in there due to hearing her suck in air, I’ll burp for 6.5 minutes.
If you want to get baby specific results for your own baby without taking 25 samples, you can continue to assume log normal distribution. You technically can get away with 2 timed samples, but the increase in confidence from 3 samples is tremendously worth it. I will continue this article using 3 samples, but you could use 2 and use that T-Value.
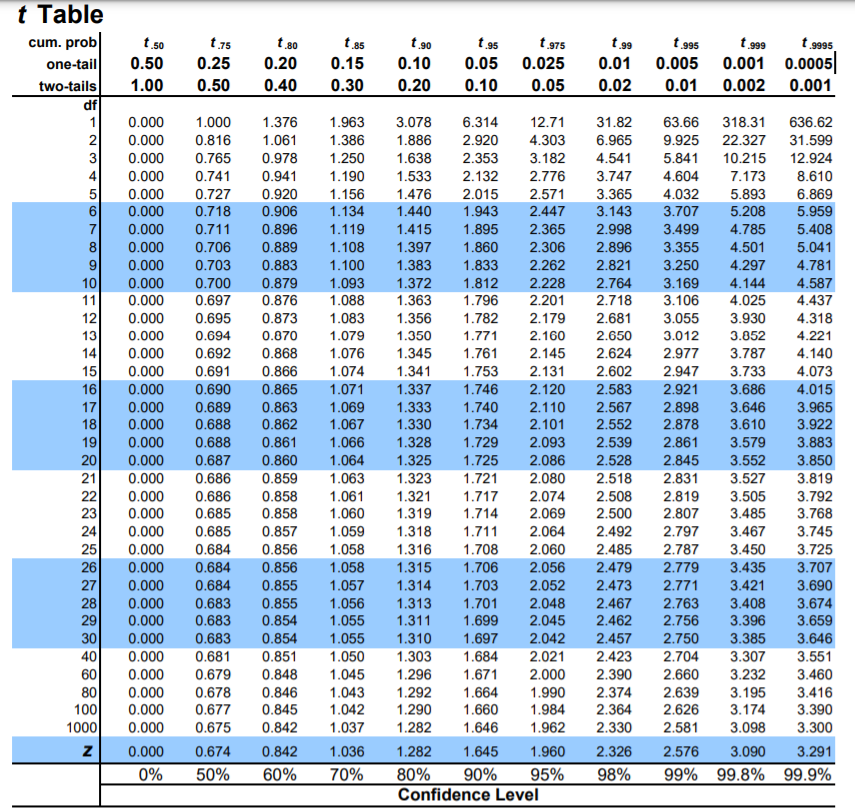
First time a sample and record it. Do this 3 times. Take each time and individually take the log of that value. You should have 3 values that are small, around the values 0-8. Calculate Mean and standard deviation of this newly calculated sample. Look up your desired confidence in a t-table(see above). 90% confidence is popular. In this example using a sample size of 3, Multiply your standard deviation by ~2.
Using this data you are ready to calculate Cumulative Distribution Function. Create numbers 1-600 in a column. Use the same standard deviation and mean for the formula, but calculate for each number from 1-600. =LOGNORM.DIST( works in both excel and google sheets. The parameter x is seconds, mean and standard deviation stays the same for each calculation, excel asks if you want PDF or CDF. If you are confused, google has been fantastic to me.
You are ready to make good decisions! What percentage of burps do you want to get out? Is 70% good enough? Find where the CDF says 0.7 and that is your new target time. Or maybe you want to ensure that burping for 3 minutes gives you a reasonable number of burps out.
Final Thoughts and Implications of Diminishing Returns
Assumptions and statistics
Note that with seemingly all statistics you make many ‘assumptions’, including perfect data, perfect fits, etc… This is obviously not the case with things that involve humans, and even with something that fits as nicely as log-normal, the start and end of the log normal curve seems aggressive. To clarify, I don’t think after 11s I have exactly 50% of burps out, and I don’t think after 10 minutes I have 87% of Aurelia’s burps out. That said, the general conclusion of burping for 1-3 minutes seems pretty solid and matches real world conditions.
Diminishing Returns is more interesting than you think
You think you understand Diminishing Returns, but consider the diminishing returns on this topic. Log Normal distribution starts off at a relatively high probability of the event, and quickly tapers off. In our problem Diminishing Returns occurs after the peak of ~3 seconds. Would you stop patting your baby on the back after 3 seconds with only 10% of burps out? Probably not.
This means the optimal stopping point probably wont be determined by diminishing returns, but rather your desired probability of burps out.
If you have been patting for about 1 or 2 minutes and debating if you should continue for another 10 seconds before giving up, give up. That 10 seconds is trivial compared to the previous time you put in.
I personally apply this study by doing the following. I begin patting our baby on the back, I look at the time and tell myself that when the clock increments 3 minutes, I can stop. This means I’ll always be burping between 2 and 3 minutes. This is somewhat low tech, but you can similarly count numbers for your baby. Consider it educational, and I’ve personally found teaching numbers can be an easy way to entertain our kids when they are melting down.
Wish you the best on preventing tears and saving time.