In-Control Bedtime: Save Time on your Bedtime routine, for you and your kids.
By taking a few measurements, you can get you (or your kids) bedtime ‘in-control’, saving you time and increasing the consistency of getting to bed on time.
Feel free to skip to the section labeled “Application” if you want the ‘too long didn’t read’ version. Things get somewhat technical in the Theory sections. Mrs. Efficiency says the theory sections are hard to read but the application section had good ideas.
(Theory) Out Of Control Processes Are Unnecessary
Being in-control or out-of-control is defined by you. You can choose to have a narrow band(1 standard deviation) that would increase your chance of a processes getting out-of-control, or you can have a wider band that guarantees(3 standard deviations) 99.7% of the time you would stay in-control. The purpose here is to identify non-random causes of variation quickly so you can eliminate them or compensate for them.
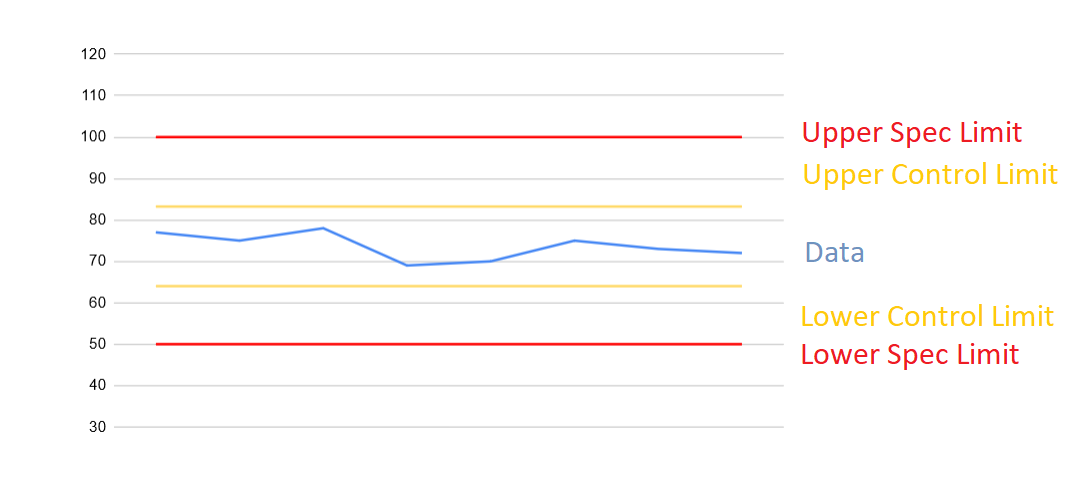
In a factory, you may have a customer specification to make a minimum of 50 parts per hour. This is not necessarily your Lower Control Limit, this is a lower Spec Limit. (Note: In this article our bed time specification and our control limit will be the same value.) Based on collected data, you have found your factory can produce 74 parts per hour on average with a standard deviation of 3 parts per hour. If you want to stay within the control limit 99.7% of the time, you’d set your Upper Control Limit to 83 parts per hour and Lower Control Limit to 64 Parts Per Hour. Now suppose a robot starts breaking more often and you only produced 30 parts. To get your process in control you might buy a redundant robot that could be turned on during a breakage. You might monitor the robot closely and do maintenance. You can even expand what you consider ‘in control’. This could be acceptable and you can opt to run the robot for 2 shifts instead of 1 shift.
Standard control chart:
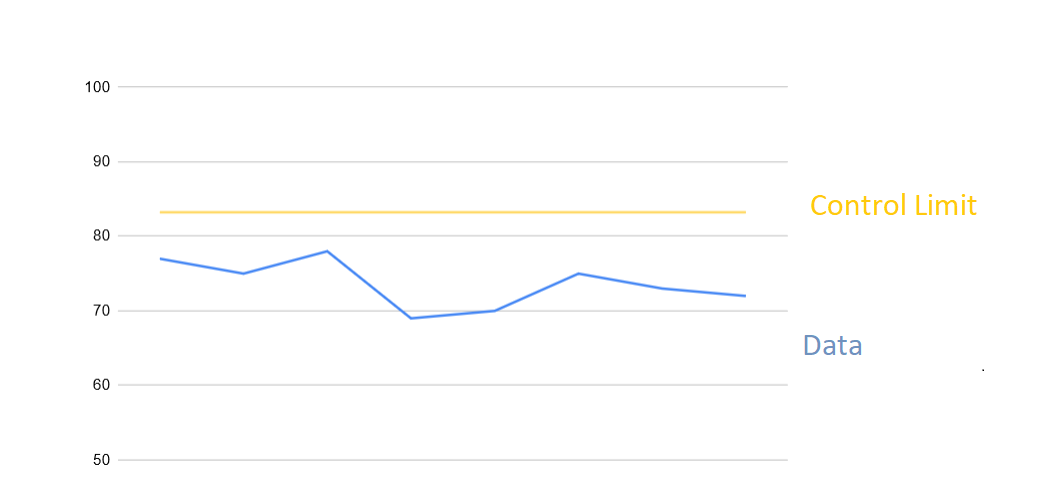
Simplified control chart:
At home, you may set your spec limit and control limit to have dinner ready at 6pm, but an extra long recipe or surprise visit from a friend could cause dinner not to be ready until 6:30pm. For these, you may consider starting dinner earlier, coming up with a plan if you have a future surprise visit, or removing long recipes from your regular list.
The benefit of control limits are to catch when your variation is increasing, and most importantly figuring out root causes and solutions to major (non-random) variation.
(Theory) Signs of Process Getting Out Of Control
Some rules of thumbs that signal that a process is getting out of control:
Any time a process falls outside the control limit
If you had ~6 consecutive points that were trending in the same direction, your process might be becoming out of control. (Ex: 15,17,19,20,22,23)
Eight consecutive points on the same side of the average
Fourteen consecutive data points alternating up and down.
(Application) Get your process In Control
Your goal is to figure out what time you need to start your bedtime routine, to ensure you get to bed on-time. In this example I’m going to use my kid’s bedtime because they are highly variable compared to me and the wife. This can be used with your bedtime routine as well.
The first and most important step to getting a process in-control is to measure and record the important metric. Without any measurements, you can’t be sure if you are hitting your targets. You also can’t determine what is an acceptable amount of variation if you have no measurement history.
For a bed time routine its probably best to measure the ‘Time In Bed’ metric. I would start the kid’s bedtime routine at 7:45PM each night and only track of the finish time.
After 3-6 measurements, you can get a general idea of what kind of variation between nights can be expected. The important thing to me was making sure my kids were in bed before 8pm. Taking your average Finish Time plus Variation, you can reliably get to bed within your ‘Control Limit’. As I realized the kids were often in bed at 8:01PM, I pushed the start of the bedtime routine back to 7:40PM.
You can also find causes of variation. If you had a measurement that was an outlier, it would be worth analyzing it and seeing if there are ways to eliminate it or prepare for it. We had an issue with kids wanting misplaced stuffed animals in their bed, but since this caused minutes of looking for toys, we removed stuffed animals from their bed. We got into a habit of giving the kids ice water before bed so I could keep the Air Conditioning at a higher temperature, now they only get it if there is extra time or I prepared ahead of time. The amount of time they get listening to/reading a book before bed can vary depending on how long they take performing their other bedtime tasks – some nights they only get a page of a book and other nights they can easily finish a whole book. These Inputs, including Start Time, will determine the Finish Time.
Finally you can further improve by honing in your process. Process flow diagrams may be a bit too rigid, but as you eliminate variation, you will be more likely to find ways to streamline the process. Trying to hit our goal time, I found myself multitasking by doing one of the steps(going through phonics) while we are walking to the bathroom. Another way to streamline is to perform a task for two children at once. Read a book that two kids like together to reduce time spent doing the same task with each child.
(Optional) Calculating Upper Control Limits and Lower Control Limits
For my personal home application, I did write down the times, but I didn’t actually calculate the standard deviation. I used feelings. Want to use something other than feelings? Calculate it:
Take some data points, at least 3 points, more is better. For instance 17, 19, 14 minutes.
Take the average so you can center your chart. For instance 16.6 minutes
Take the standard deviation(use a calculator/excel/google sheets). Multiply that standard deviation by 3 if you only want 1 failure per every other year. Only multiply by 2 if you want ~8 failures per year. For instance, 2.5*3=7.5 minutes or 2.5*2= 5 minutes. (single tailed normal distribution)
Take the average and add the standard deviation you calculated. 16.6 minutes + 7.5 minutes= Start the bedtime process 24.1 minutes before bedtime. (or I’m less critical, and will use the 2 standard deviation, 16.6 minutes + 5 minutes = 21.6 minutes.)
Trying to get the kids to bed by 8pm? Start the process at 7:38pm. It will work 357 days per year.
Process changes
Don’t expect a process to be in control forever. In a factory its common for changes to occur. Maybe you got a faster robot, maybe your customer wants an additional piece of foam glued on. These would involve getting the process back in control.
At home, you might have gotten injured and decide to include a round of physical therapy exercises in your bedtime routine. After a few measurements you can decently decide what time you need to start your bed time routine to get to bed on time.
The big take away here is that by having your process in control you can quickly spot non-random variations and make adjustments.